Our projects
code is a
promise of
quality
First in the process.
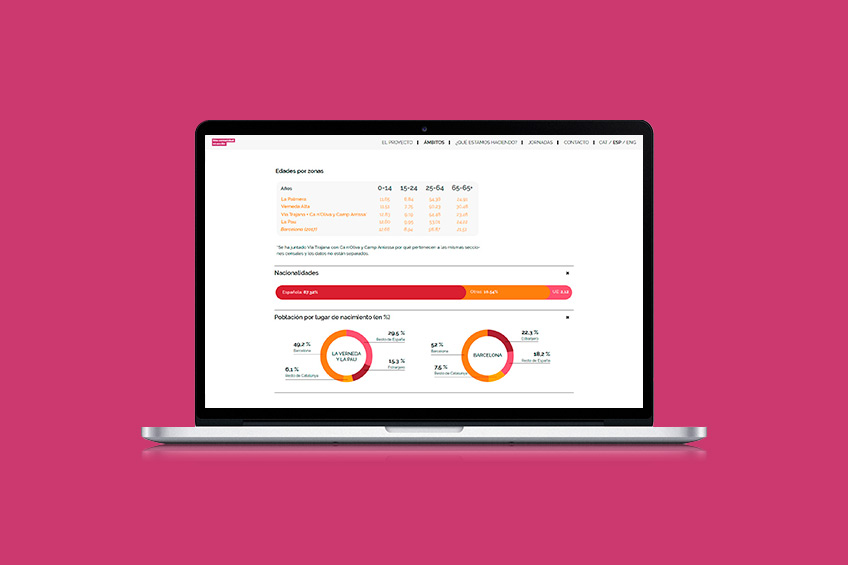
We create infographics and visual content that make complex information clear, structured, and easy to understand—helping you present data, processes, and comparisons more effectively.
When we create infographics and visual content, we don’t see them as mere decorative elements or simple aesthetic adaptations of data. We approach them as communication tools designed to translate complex information into a clear, organized, and easily understandable format.
In technical environments or those with a high volume of information, explaining processes, comparing data, or summarizing content can be challenging without proper structure. Visual representation helps simplify these messages, highlight what matters, and enable faster, more effective reading. That’s why every infographic should be built on a clear logic, with design and content working seamlessly together.
Our typical workflow in this area begins with an initial analysis phase, where we assess the available information, its complexity, and the specific objectives for each piece. Based on these insights, we define the structure, hierarchy, and most effective visual approach to organize the content.
The final phase focuses on designing, refining, and adapting each piece for different platforms, ensuring readability, visual consistency, and seamless integration with the brand system. The result is a set of visual assets that are clearer, more accessible, and purpose-built to communicate complex information accurately—making it easier to understand and strengthening your company’s messaging.
Key insights on methodology, investment, and digital project development.
A well-designed infographic makes it easy to communicate complex ideas visually, helping audiences quickly grasp key data or processes. In a corporate setting, it strengthens visual identity, amplifies your message, and streamlines decision-making by presenting information in a clear, structured way.
Visual content—such as infographics, diagrams, or illustrations—is planned from the architecture stage, with its placement determined by communication goals and user experience. This ensures that visual elements support the user journey, reinforce strategic messaging, and maintain consistency with the corporate identity.
Visual consistency is achieved by applying the graphic system and brand identity elements established during the branding phase: color palette, typography, iconography style, and graphic patterns. This approach ensures that every infographic not only communicates effectively, but also strengthens brand recognition and credibility across all digital touchpoints.
Yes. Infographics and other visual assets can be optimized with descriptive alt attributes, relevant titles, and contextual integration within the text. Additionally, using lightweight and responsive formats enhances performance and accessibility—factors valued by both users and search engines.
We assess your current situation and outline the next steps.
Contact now
We assess your company’s context, objectives, and digital presence. Before starting the design phase, we define the core architecture and set key priorities.
We craft your visual identity and structure your content, always prioritizing clarity, consistency, and an outstanding user experience.
We implement your project to the highest standards of performance and stability, ensuring seamless integration with other systems whenever required.
We continuously monitor, optimize, and enhance your digital project to drive its growth alongside your business.
We will review your current digital situation. We will get in touch to understand your context and jointly assess which areas to analyze, after which we will prepare an audit including key findings and recommendations.